1. Introduction
The rapid expansion of metabolomics studies, particularly in databases like Metabolomics Workbench and Metabolights, underscores the need for sophisticated tools capable of efficiently managing and analyzing mass spectrometry data. My research focused on refining the ADAP-KDB algorithm [13], crucial for efficiently processing mass spectrometry data, including identifying and prioritizing spectra of both known and unknown compounds. This enhancement is key to effectively analyzing extensive metabolomics data, enabling the identification of distinct metabolic signatures. In parallel, I developed a pipeline to discern these signatures through untargeted metabolomics studies. This dual approach aims to reveal robust metabolic patterns, crucial for understanding disease mechanisms and enhancing diagnostic and treatment strategies in biomedical and public health research.
2. Methods and Results
A. Workflow
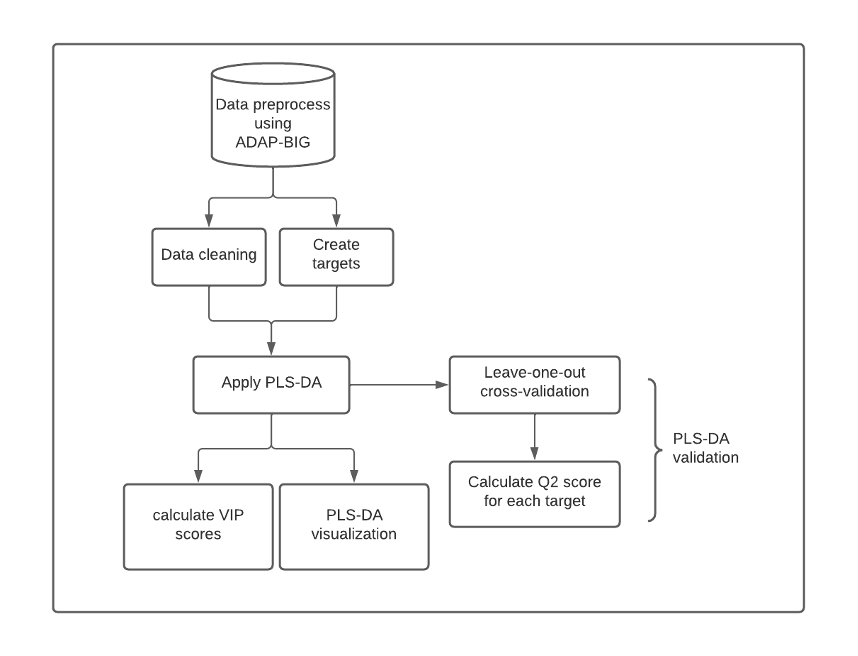
Figure 1: Metabolic Biomarkers Discover Pipeline. Raw metabolomics data are processed using ADAP-BIG for formatting and machine learning compatibility. Data undergo cleaning, imputation, scaling, and target creation before being analyzed with Partial Least Squares Discriminant Analysis (PLS-DA). VIP scores quantify metabolite contributions to group separation, with a threshold of 1 used to identify metabolic signatures. Model performance is validated via cross-validation, and results are visualized.
B. Dataset
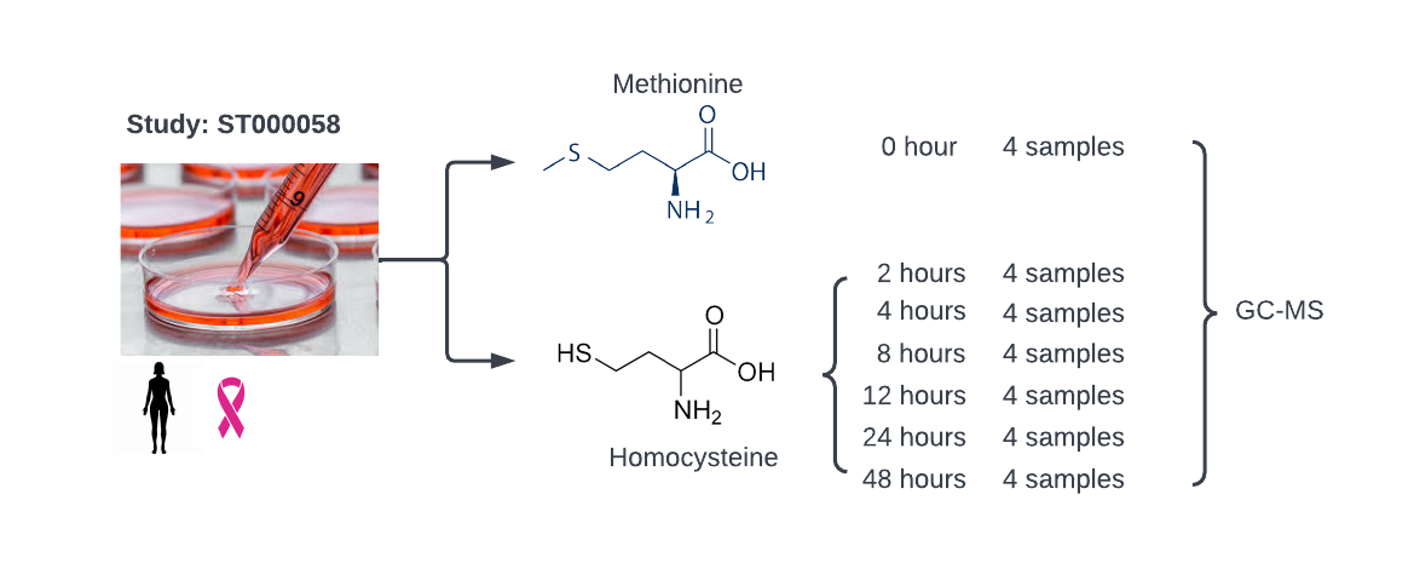
Figure 2: Metabolic profiling of Methionine Dependence in Breast Cancer Cells. Study ST000085 from Metabolomics Workbench investigates the metabolic response of MB468 breast cancer cells, their methionine stress-resistant derivative MB468RES, and MAT knockdown cells (MB468shRNA) following a shift from methionine to homocysteine-containing media. Untargeted metabolomics, targeted analysis of methionine pathway intermediates, and metabolic flux analysis are conducted at 0, 2, 4, 8, 12, 24, and 48 hours post-media switch to identify metabolic signatures linked to cancer cell methionine dependence and proliferation arrest.
C. PLS-DA Results
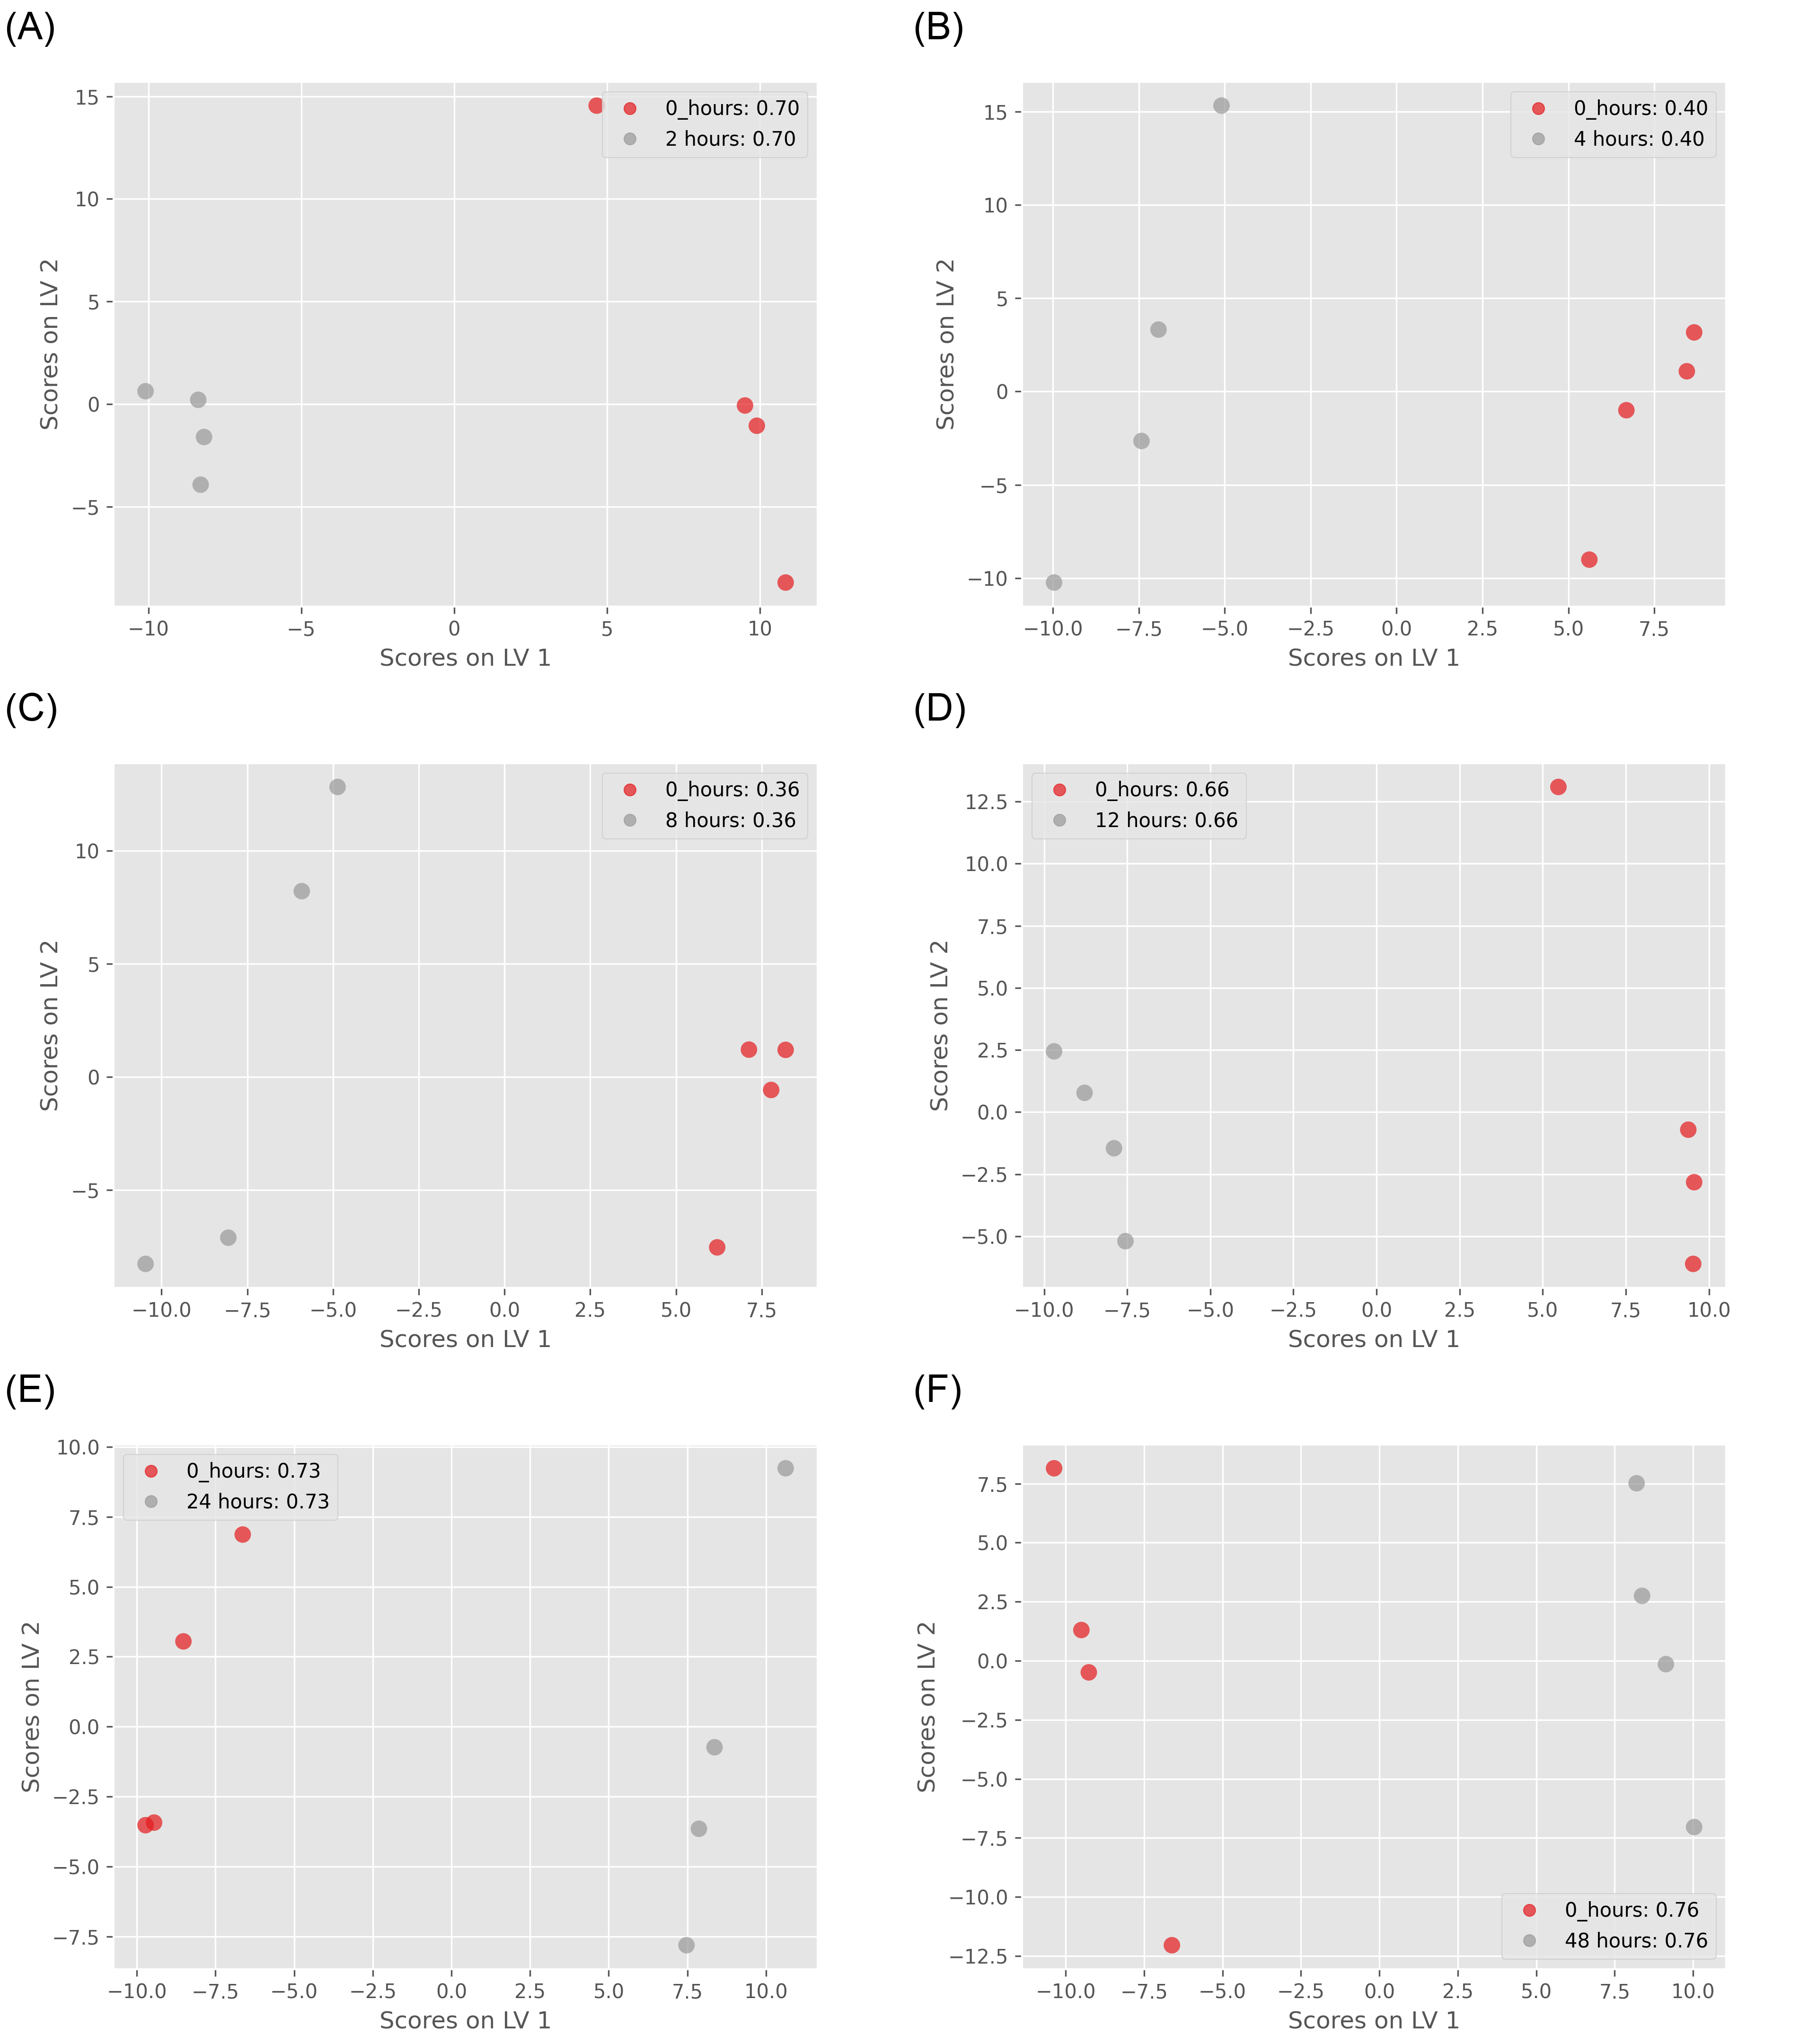
Figure 3: ST000085 PLS-DA Visualization of the First 2 Latent Vectors: The predictive capability of the model is assessed through Q2 scores after leave-one-out cross-validation. (A) control group vs. 2 hours treatment group (Q2=0.7); (B) control group vs. 4 hours treatment group (Q2=0.4); (C) control group vs. 8 hours treatment group (Q2=0.36); (D) control group vs. 12 hours treatment group (Q2=0.66); (E) control group vs. 24 hours treatment group (Q2=0.73); (F) control group vs. 48 hours treatment group (Q2=0.76);
D. Permutation Test for Model Validation
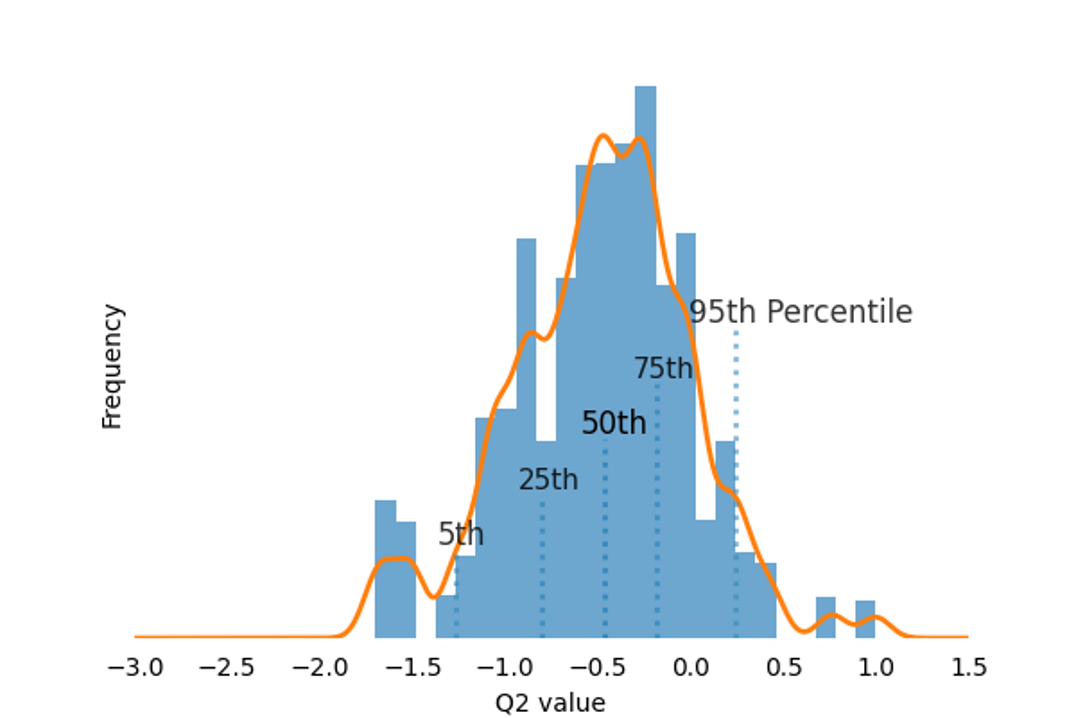
Figure 4. Permutation test for PLS-DA Model Validation. A permutation test (10,000 iterations) was conducted on Group 1 (0 hour) and Group 7 (48 hours) using Partial Least Squares Discriminant Analysis (PLS-DA) with leave-one-out cross-validation (LOOCV) to calculate Q² values. The resulting Q² distribution was used to assess model validity and ensure that the observed classification performance was not due to random chance.
E. Comparison between PLS-DA and ANoVA test
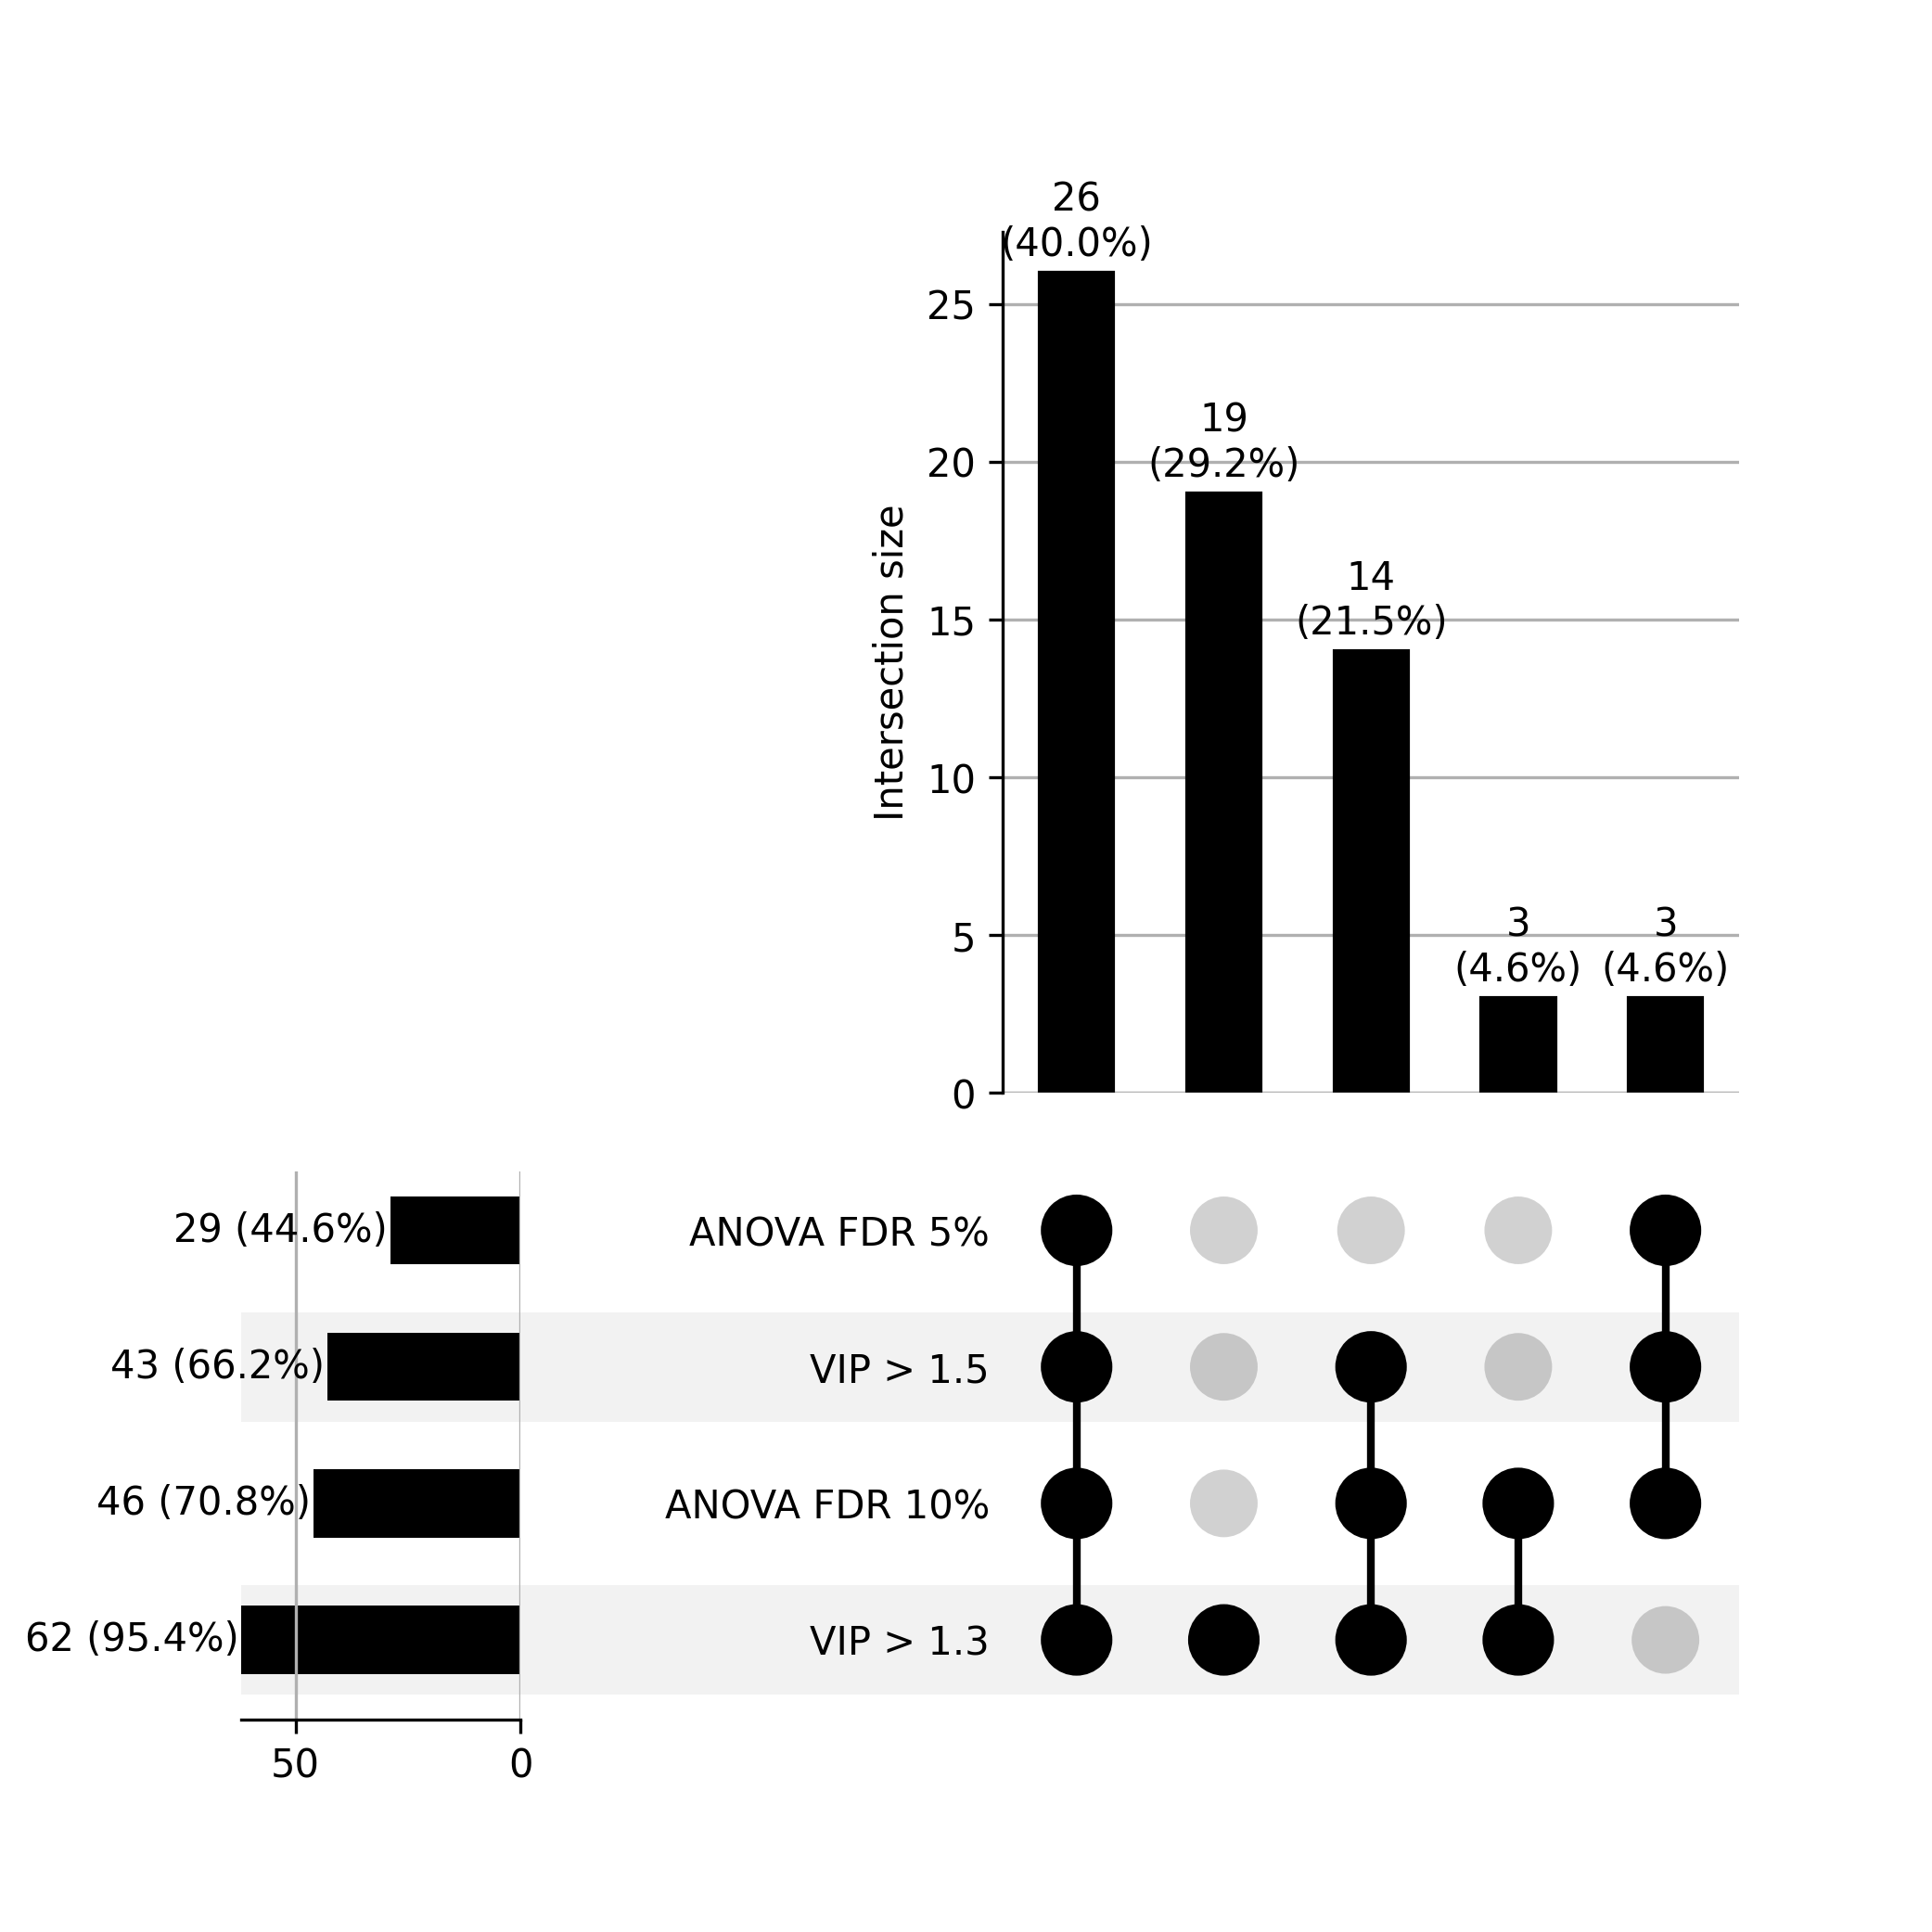
Figrue 5. Upset Plot: Compare Biomarker Identification Reults between PLS-DA and ANoVA Test. VIP cutoff in PLS-DA is 1.3 and 1.5; FDR threshold for anova test is 5% and 10%.